African livestock systems’ greenhouse gas emission intensities are not as high as believed and potential avenues to reduce them
Written by Phyllis Ndung’u
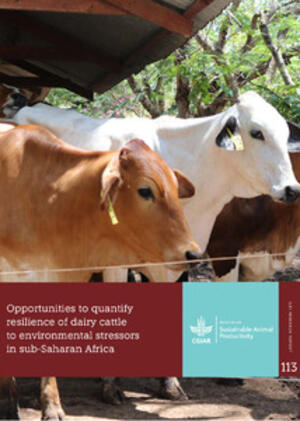
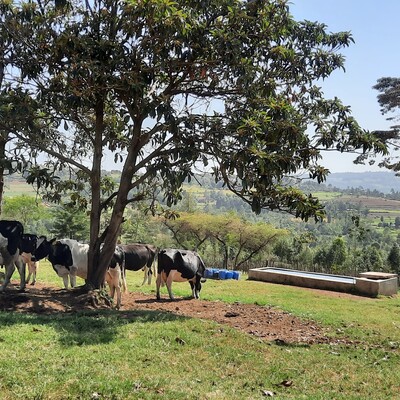
 Dairy cow in a smallholder mixed crop-livestock system. Photo credit: ILRI/Sonja Leitner
Ruminants are central to the economic and nutritional life of much of sub-Saharan Africa, but cattle are now blamed for having a disproportionately large negative environmental impact through emissions of greenhouse gas. This happens because the extent to which African livestock systems contribute to global emissions is hardly understood due to insufficient evidence-based research. Our research showed that the emissions intensities (EI) of smallholder livestock farms vary widely with up to 50% of the sampled smallholder livestock farms having EI similar to mean Pan-Europeans emissions intensities i.e., 2.1 – 5.0 vs 2.13 vs 2.8kg CO2-eq/kg FPCM for the present study, Ireland and global estimate respectively[1], [2],[3].
 Distributions of farm-level emission intensities for cattle in smallholder farms in Nandi, Bomet and Nyando. (Ndung’u PW, Takahashi T, du Toit CJL, Robertson-Dean M, Butterbach-Bahl K, McAuliffe GA, Merbold L, Goopy JP. Farm-level emission intensities of smallholder cattle (Bos indicus; B. indicus-B. taurus crosses) production systems in highlands and semi-arid regions. Animal. 2022 Jan;16(1):100445. doi: 10.1016/j.animal.2021.100445. Epub 2022 Jan 10. PMID: 35026676).
A couple of years ago, the Mazingira Centre in ILRI embarked on improving emissions estimates from the livestock sector in Kenya. The team developed data collection protocols to collect activity data needed to calculate IPCC Tier 2 emission factors[4] for the animal (enteric fermentation)[5] and manure[6] GHG emissions. The protocols were used to collect data for three different regions in Western Kenya (Nyando, Nandi, and Bomet).
Estimated EFs for the different systems by location were published previously[7],[8],[9]. Nonetheless, accurate estimation of EFs for animal (enteric fermentation[10]) and manure emissions alone do not capture manure and animal-related emissions, such as emissions for the production of fodder on or off the farm. In contrast, a farm’s carbon footprint captures the total amount of greenhouse gases (GHG) that is generated to produce a product and presents the GHG emissions per unit of product [also referred to as emission intensity (EI)], which allows comparing between farm systems. Consequently, to capture variability in GHG emissions of smallholder systems and compare between farm systems, we employed carbon footprinting.
In detail, farm GHG emissions such as enteric fermentation, manure management, and feed production were calculated by using activity data collected in smallholder livestock farms. Emission intensities (emissions per product) were calculated as total GHG emissions of the farm (i.e., cradle to farmgate – an assessment of a partial farm product life cycle from resource extraction (cradle) to the farm gate) divided by the total farm output (milk and meat protein produced by the farm).
On average milk contributed 80-85% and meat contributed 15-20% to the farm protein output. From the various emission sources (animal, manure, fodder production), enteric fermentation contributed over >95% of the farm’s emissions. Hence, mitigation efforts to reduce farm emissions should focus on enteric fermentation, exploring strategies that improve feed and animal management that can increase production and reduce emissions per product. Further, smallholders that had fewer productive animals had higher emissions per product. Thus, animal management strategies, such as herd restructuring to increase the number of productive animals on a farm could be a viable option to reduce emissions per unit of the product of smallholder farms.

